
Google Forms keeps your responses in five separate places. Most guides list them and stop there, which is why people still end up in the wrong tab. Each one answers a different question, so this covers what each one shows and the point where it runs out.
Key facts
Responses land in the form's Responses tab the moment someone submits, and that tab holds three views of the same data: Summary, Question and Individual. A linked Google Sheet and a CSV download are the two ways to get the data out.
- 5 places the same answers appear: the Summary, Question and Individual tabs, plus the linked Sheet and a CSV
- The Summary tab only appears once there is at least one response (Google Docs Editors Help)
- CSV export lives under More on the Responses tab, as Download responses (.csv) (Google Docs Editors Help)
- Respondents see nothing by default. They only get a results link if the owner turned on the response summary (Google Docs Editors Help)
- That summary is visible to anyone who can respond, which is worth checking before switching it on
Open your form and click Responses. Three tabs sit there: Summary for charts, Question for one question at a time, and Individual for one person at a time. Two more routes live outside those tabs: the linked Google Sheet for raw rows, and Download responses (.csv) for a file you can hand to something else.
Where do Google Forms responses go?
Pick the row that matches the question you are trying to answer, then jump to it.
| Where to look | What it shows | Best for | Where it stops |
|---|---|---|---|
| Summary tab | Charts, averages and the most common answers | Reading the room in one glance | No filtering and no segments, so you cannot see just one group |
| Question tab | One question at a time, every answer to it | Spot-checking a single question | No cross-question view, so you cannot tie an answer to anything else |
| Individual tab | One respondent at a time, their whole submission | Following up with a specific person | You page through one by one, with no search across submissions |
| Linked Google Sheet | Every submission as raw rows | Sorting, filtering and formulas | A separate file to keep in sync, and charts you build yourself |
| CSV download | A point-in-time file of everything | Handing data to another tool | A snapshot, so it is stale the moment the next response lands |
All five, in one minute
Summary, Question, Individual, the linked Sheet, then CSV. The detail on each one follows.
1. What does the Summary tab show?
The default view when you open Responses. Google builds a chart per question: bar charts for multiple choice, a list for short answers, an average for linear scales.
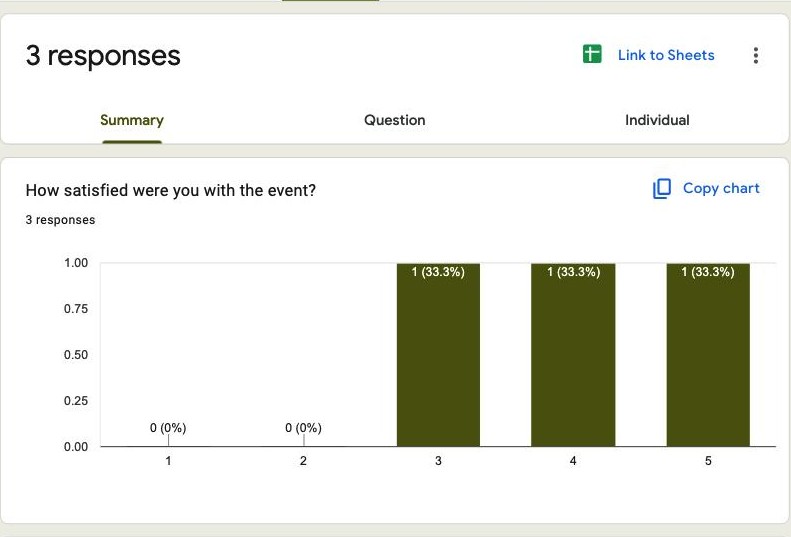
How to get there. Open your form, click Responses, then Summary.
Where it stops. There is no filter anywhere on this tab, so you cannot look at only the responses from one team or one date range, and a survey with two distinct audiences ends up reading as one blurred average.
2. What does the Question tab show?
Shows a single question with every answer given to it, and a pair of arrows to step through the rest.
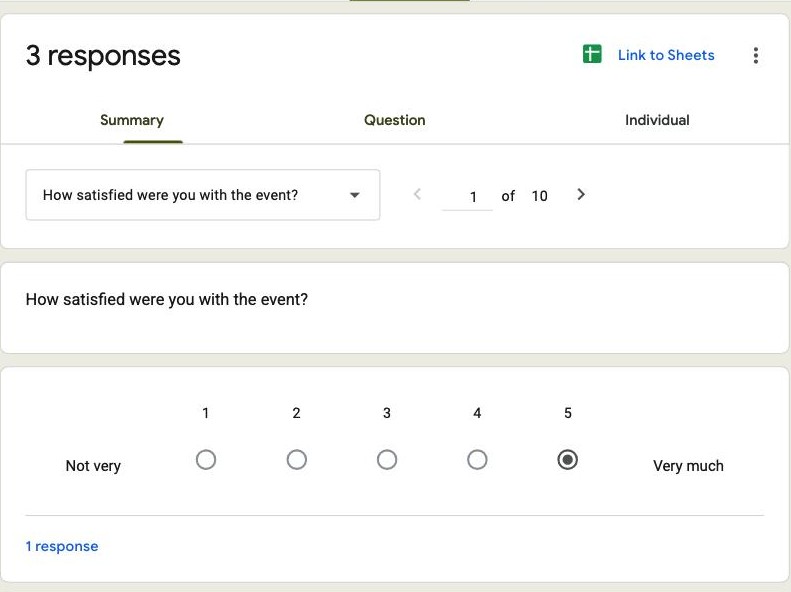
How to get there. Click Responses, then Question, then use the arrows or the dropdown to pick a question.
Where it stops. It isolates the question by design, so you cannot see who gave a particular answer without switching to the Individual tab and hunting.
3. What does the Individual tab show?
One respondent's whole submission on screen, laid out like the form they filled in. This is the view to use before replying to someone.
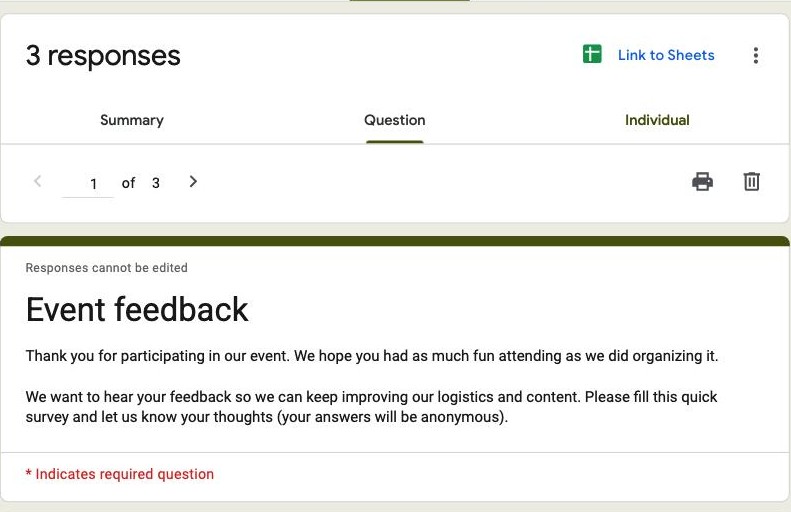
How to get there. Click Responses, then Individual, then page through with the arrows.
Where it stops. Paging is the only navigation you get, so with 300 submissions and no search box, finding one person means clicking through or giving up and going to the Sheet.
4. How do you send responses to a Google Sheet?
Sends every submission into a Google Sheet, one row per response, updating as new ones arrive. This is where sorting, filtering and formulas become possible.
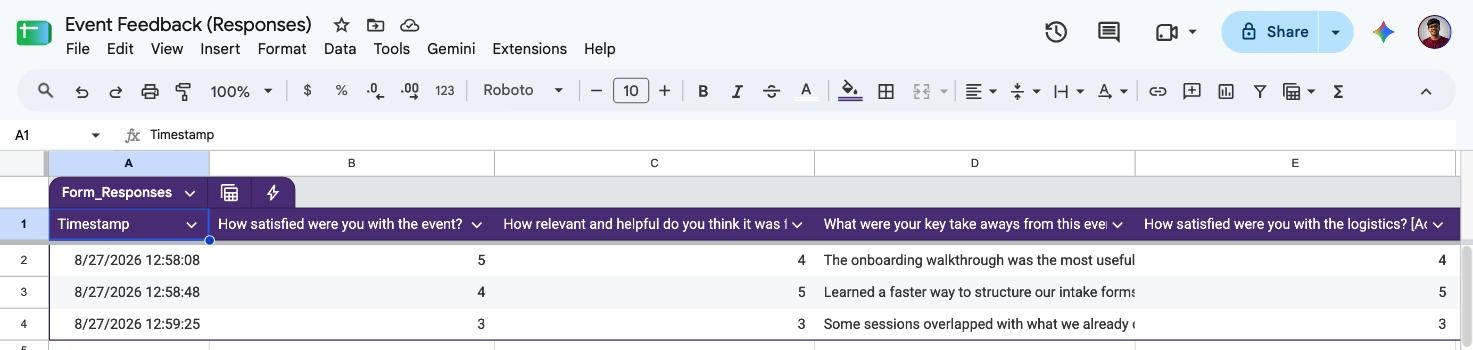
How to get there. In the Responses tab, click the Sheets icon, then either create a new spreadsheet or pick an existing one.
Where it stops. It is a second file to manage, with its own sharing settings. Anyone you give edit access to the Sheet can see every response, which catches people out on anonymous surveys.
5. How do you download responses as CSV?
A one-off file of every response, for a tool that will not read a Google Sheet.
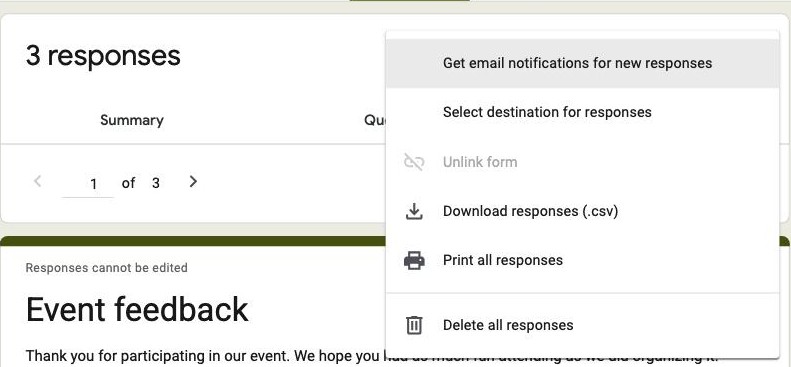
How to get there. In the Responses tab, open the three-dot menu and choose Download responses (.csv).
Where it stops. The file is only ever a snapshot, out of date the moment the next response arrives, which turns a weekly report into a weekly re-download.
Can you see your own response after you submit?
This is the question behind a lot of searches for Google Forms responses, and the answer is usually no. As a respondent you get your answers back only if the form owner set it up in advance, and there is no list of forms you have submitted anywhere in Google Forms.
- If the owner turned on response receipts. Google emails you a copy of your answers, but only when the form collects respondent emails and the owner enabled receipts in Settings. Search your inbox for the form name.
- If the owner allowed editing. That receipt email carries an Edit your response link, which reopens your submission with your answers still in it.
- If neither was switched on. There is no way to retrieve it yourself. Ask whoever owns the form to look you up in their Individual tab.
If you are the one building forms and want people to keep a copy without depending on a setting they will never find, that is worth designing in from the start rather than bolting on afterwards.
Tired of exporting to read your own data? Formester charts every question in the dashboard with filters built in, so there is no linked spreadsheet to maintain.
How do you delete a Google Forms response?
Deleting is per response and it is permanent, so read the row before you click.
- Click Responses, then Individual.
- Page to the submission you want gone.
- Click the bin icon, then confirm.
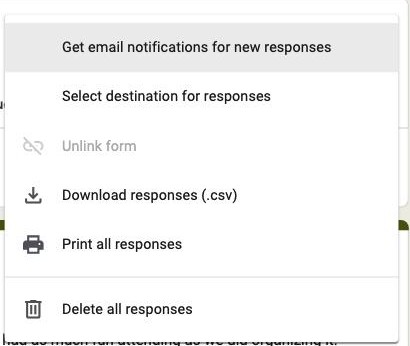
To clear everything, use Delete all responses in the three-dot menu. Neither action touches rows already written to the linked Sheet, so a deleted response still sits in the spreadsheet until you remove it there too.
Google Forms, the linked Sheet or dedicated analytics: which should you read?
| What you need | Google Forms | Linked Sheet | Formester |
|---|---|---|---|
| Charts without setup | Summary tab | Build them yourself | Summary per question |
| Filter to one segment | Not available | Formulas or pivot | Filters in the dashboard |
| Search across submissions | Not available | Sheet search | Search and star submissions |
| See where people dropped out | Not available | Not available | Drop-off rate and drop-off pages |
| A PDF of one response | Print to PDF | Not applicable | Per-response PDF export |
| Partly finished submissions | Not captured | Not captured | Partial submissions |
Why Formester's response dashboard is the better choice
Everything the five Google Forms views make you stitch together, in one place.
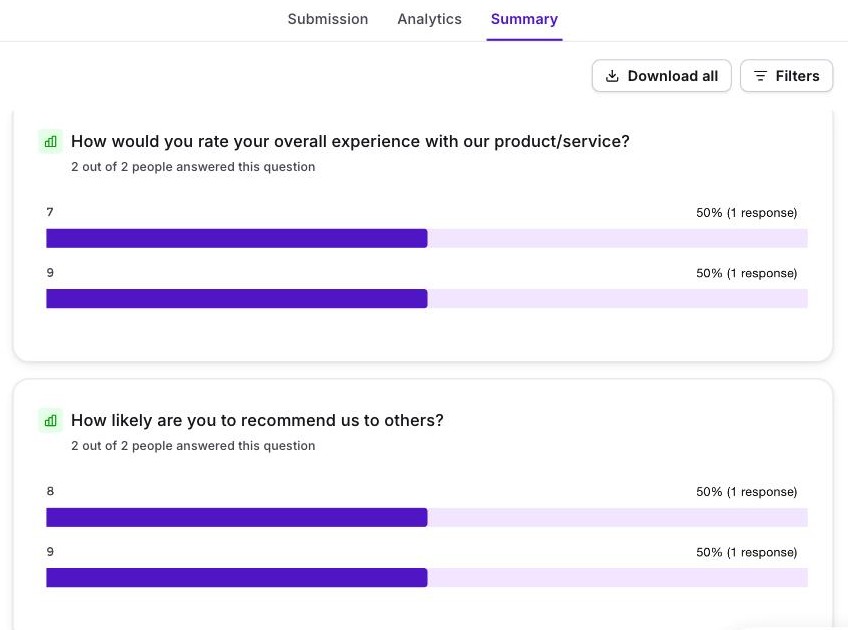
- Summary analytics per question for scale, star, ranking and choice fields, with filters and segments instead of one blurred average
- Drop-off pages plus completion rate, so you can see where a long form loses people
- Search, star and spam-mark individual submissions, plus a PDF of any single response
- Partial submissions captured, so an abandoned form is still data
Related reading
- Summary analytics - the room-read dashboard, per question, without building charts.
- Conditional logic - show or hide a single question based on an earlier answer.
- Conditional questions in Google Forms - what section-level branching can and cannot do.
- Build a questionnaire in Google Forms - structure and question types before you collect anything.
- Make a poll in Google Forms - the quickest single-question setup.
- Signup sheets in Google Forms - slots, caps and the workarounds people use.
- Google Forms alternatives - when the ceiling is the problem rather than the setup.