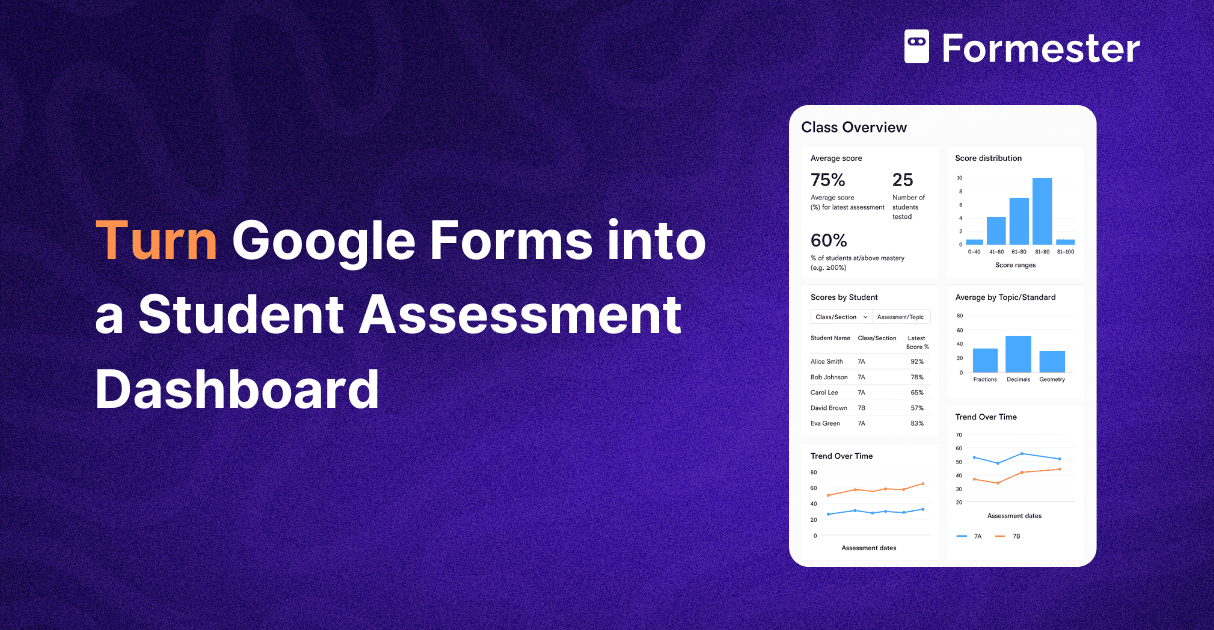
How to Turn Google Forms into a Student Assessment Dashboard
Creating a complete student assessment dashboard from Google Forms is possible even if you do not have technical skills. You only need a clear workflow.
When you set it up correctly, each quiz response becomes live data. This data shows student scores, mastery levels, trends, and next steps. This guide explains the full process and shows you how to build, structure, automate, and improve your dashboard.
Why Build a Student Assessment Dashboard?
A dashboard helps you see learning patterns that you miss when you only look at individual quiz scores. When you use Google Forms with Google Sheets, you turn simple quizzes into a real time assessment system. You no longer check scores one by one or sort data by hand. You view class performance in one place without extra work.
You also support students better. You spot who needs help, which topics need review, and which students are improving over time. This gives teachers clear direction and reduces guessing.
The setup is also budget friendly. Schools already use Google Workspace, so you do not need new tools or extra training. The workflow is easy to scale, easy to share, and reliable for daily classroom use.
Google Forms is a great choice for teachers, trainers, and education teams. It offers a simple way to assess data.
Step 1: Build the Quiz in Google Forms
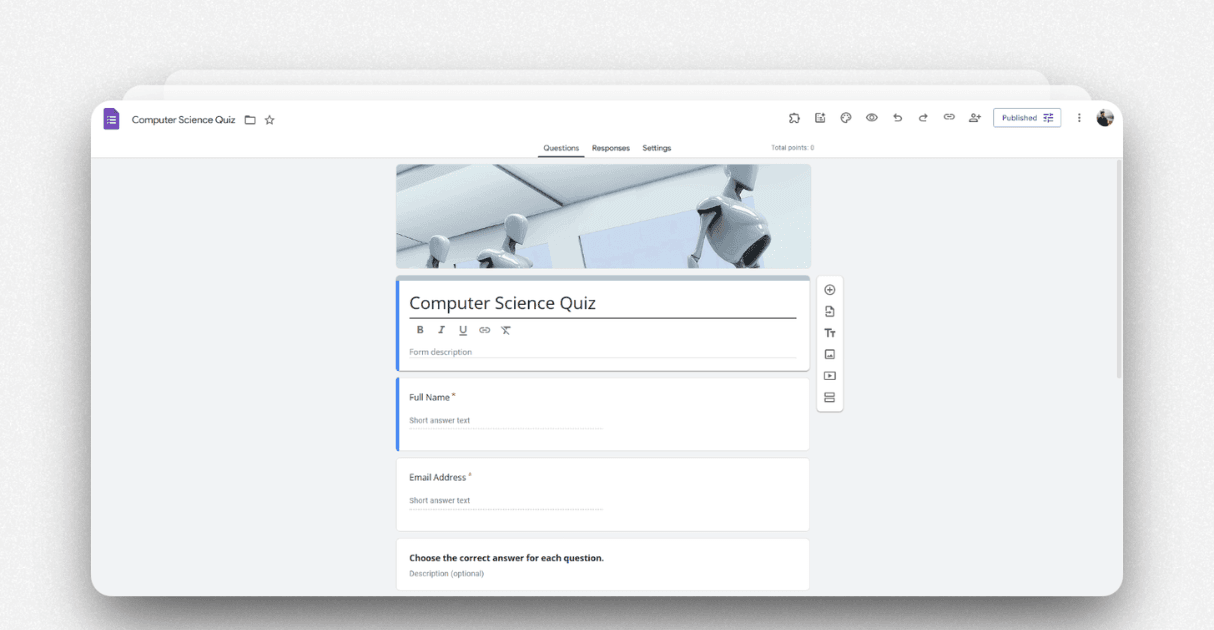
Start by opening a new Google Form. Switch the form to Quiz mode inside the settings. Quiz mode allows automatic grading, points, and correct answers. This saves you a lot of time later because you do not need to grade anything by hand.
Add clear question types that work well for assessments. You can use multiple choice questions for simple questions with one correct answer. You can use checkboxes when more than one answer is correct. You can use short answer questions when you want short written responses.
Set a point value for each question and choose the correct answers. This prepares the data for clean scoring in your dashboard.
Next, add fields that help you identify each student. Add student name, email, class or section, and student ID if your school uses it. These fields become the main filters in your dashboard. They help you group results by class, track student progress, or compare performance between units.
At this stage, your quiz is ready. It collects answers, grades them, and stores key information about each student. This sets a strong base for the next steps.
Step 2: Link Form Responses to Google Sheets
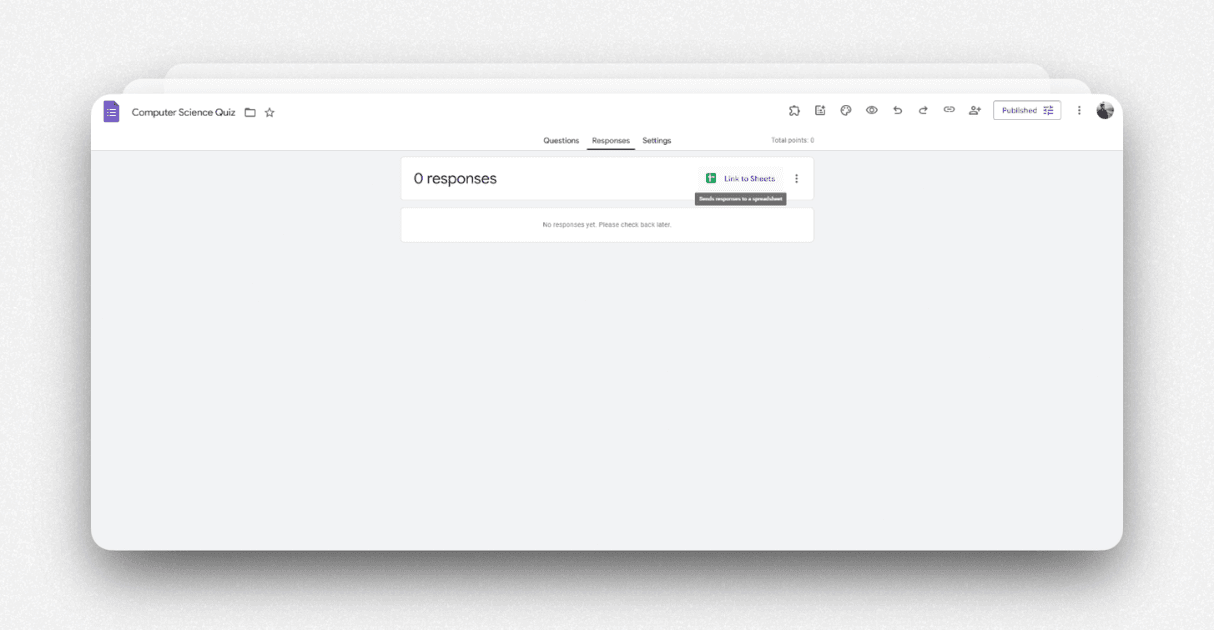
 Now open the Responses tab inside Google Forms. Click the Google Sheets icon.
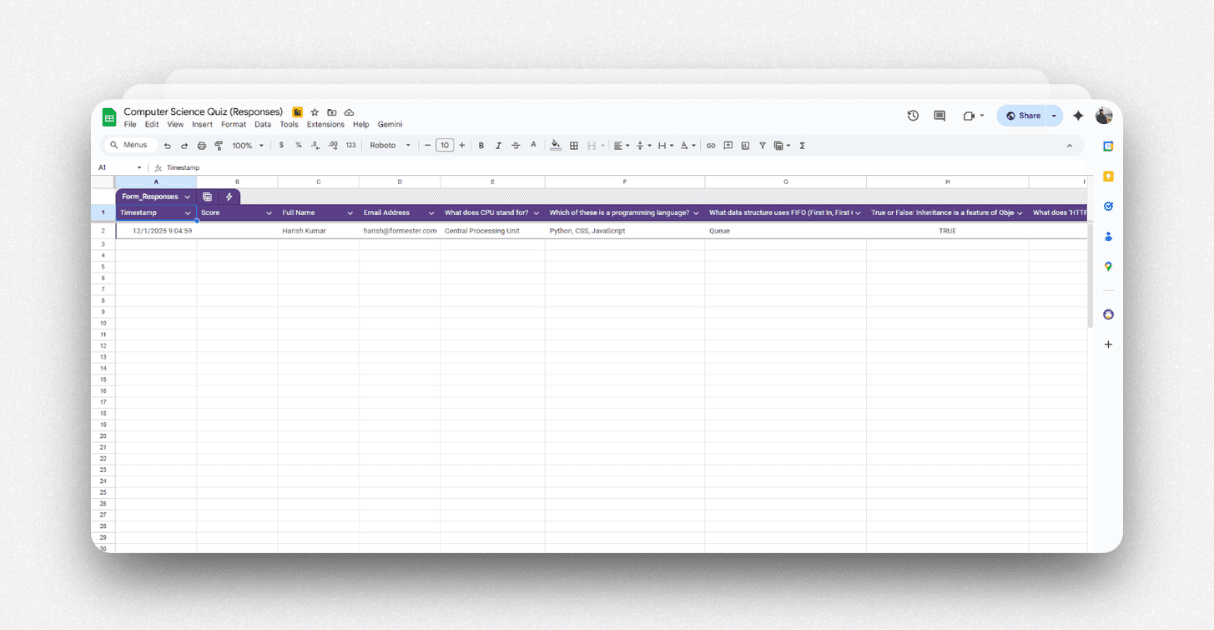
This creates a new sheet or connects to an existing one. From now on, every student submission appears as a new row in this sheet.
You do not need to move data or copy anything. The form sends the data to the sheet for you.
Check the sheet to make sure it contains all the fields you need. This includes student name, email, total score, individual question scores, and the timestamp. These fields help you build dashboards that show daily performance, class wise progress, and overall mastery levels.
Step 3: Structure the Spreadsheet for Analytics
Your sheet now contains raw data. Raw data is important, but it is not ready for a dashboard yet. You need to prepare it so the charts work smoothly and update automatically.
First, keep the raw data untouched. Do not edit or delete anything inside the default tab named Form Responses 1. This tab must stay clean because it is the source that updates in real time whenever a new response arrives.
Next, add a new tab in the same sheet. Name it Dashboard Data.
In this tab, you reference the raw data using simple formulas. You can use functions like Average, If, or Sum. These formulas help you calculate percentage scores, pass or fail values, and topic level performance.
Add helper columns to make your dashboard easier to filter. You can add fields like assessment name, unit, topic, or class group. These helper fields allow you to slice your data inside charts and pivot tables.
Pivot tables help you summarize large sets of data. You can use them to calculate the class average, the average for each student, or the number of students in each mastery band. For example, you can count how many students scored below sixty, between sixty and eighty, and above eighty. These summaries show clear patterns that help teachers take action.
When you finish this step, your sheet contains clean, structured data that is ready for your dashboard.
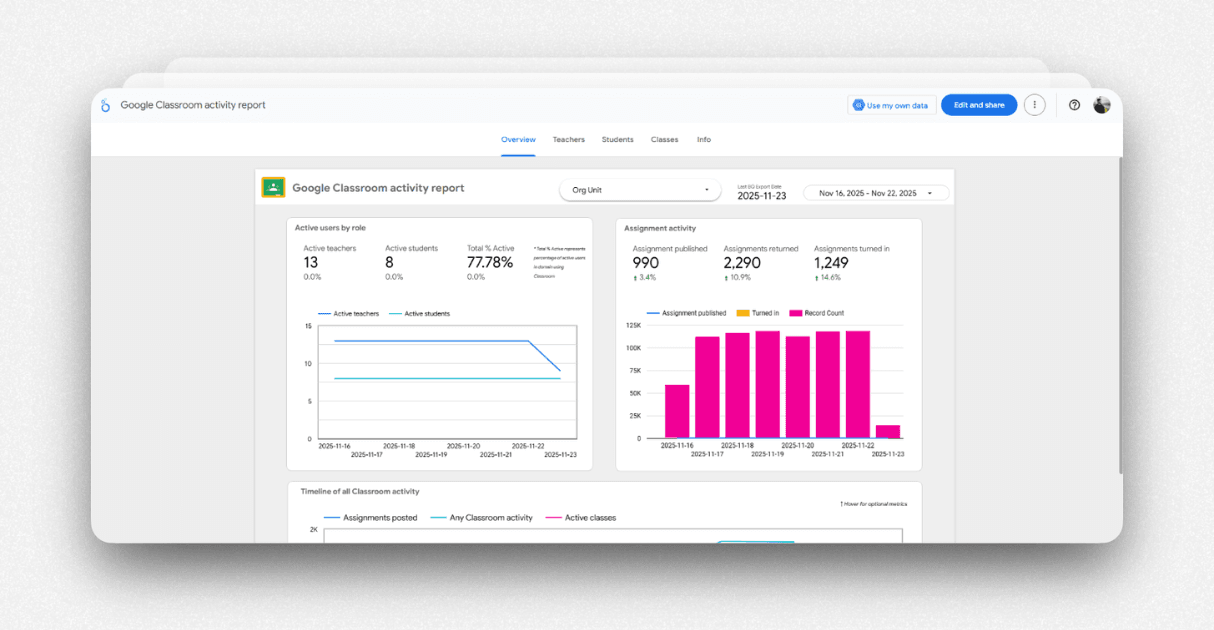
Step 4: Build a Visual Dashboard
A well designed dashboard helps you read the data at a glance. You do not need to scroll through rows or search for numbers. Charts, scorecards, and trend lines present the information in a clear visual way.
You can build your dashboard in Looker Studio or Google Sheets. Looker Studio gives you more interactive features and more room for custom views. Google Sheets is simple and fast when you want a basic dashboard.
If you choose Looker Studio, start by creating a new report. Connect your Google Sheet as the data source. Choose either the raw data tab or the cleaned Dashboard Data tab. Then add the charts you want.
A score distribution chart helps you see how the class performed overall. A topic level bar chart shows mastery across different units.
A student table helps you review individual performance and filter by class, topic, or date. A trend line shows how scores improve or drop over time.
If you choose Google Sheets charts, stay inside the Dashboard Data tab. Insert bar charts, line charts, or simple scorecards. Add slicers so you can filter by class or assessment date. Sheets dashboards may be simpler, but they still update in real time when new data arrives.
Step 5: Share and Automate
You can now share the dashboard. If you use Looker Studio, share the link with view only permission. If you use Sheets, share the sheet with restricted access. You can also embed the dashboard inside your school portal or LMS.
The best part of this setup is that everything updates on its own. When a student submits the quiz, the form sends the data to the sheet. The formulas then update the calculations, and the dashboard refreshes. This automation reduces manual work and keeps your data accurate.
Step 6: Optional Enhancements
You can improve your dashboard even more with a few simple additions. You can use conditional formatting to highlight students who scored below mastery.
You can use validation rules inside Google Forms to avoid blank responses or wrong formats. You can add topic level scoring to track performance in each lesson. You can even export your cleaned data to other business intelligence tools for deeper analysis.
These improvements help you gain more clarity without extra effort.
Tips for a Cleaner Dashboard
Keep raw data untouched. Label columns clearly. Use helper columns only when you need them.
Test your workflow with a few sample responses. If you plan to use multiple assessments, copy the sheet structure instead of changing old sheets.
When to Upgrade Beyond Google Forms
This setup works well for simple and medium size assessments. But it becomes slow and hard to maintain when you manage many forms, many sheets, or advanced dashboards. You may also need automation for grading, notifications, or data cleaning.
In these cases, a free Google Forms alternative like Formester helps you handle everything inside one platform. You can make quizzes with AI. You can grade them right away.
You can use clean data. You can link the results to dashboards without any manual setup.
Conclusion
Google Forms and Google Sheets give you a complete workflow to create a student assessment dashboard. By creating the quiz and linking it to Sheets, you can organize the data. This helps you design a dashboard that gives a clear view of student learning. With a little setup, everything updates in real time and scales to any class size.