To add a linear scale question in Google Forms, add a question, change its type to Linear scale, pick the low and high numbers, and type a label for each end. Four clicks and two labels, under a minute.
Two things are worth knowing before you build a whole survey on it: the scale stops at 10 and only the two ends take a label, and there is a separate Rating type for stars, which is what many people reaching for a scale actually want.
Quick answer
- Add it: plus icon, question type dropdown, Linear scale. Set the range with the two dropdowns (0 or 1 at the low end, 2 to 10 at the high end), then fill the two optional labels.
- Know the ceiling: ten points maximum, labels on the ends only, no scoring, no slider. Several statements on one scale is a Multiple choice grid, not several linear scales.
- Numbers or stars: Linear scale gives you numbers, which chart and average cleanly. Rating gives you stars, hearts or thumbs, which people answer faster. Pick by what you will do with the data.
How do you add a linear scale question in Google Forms?
-
Add a question and type it
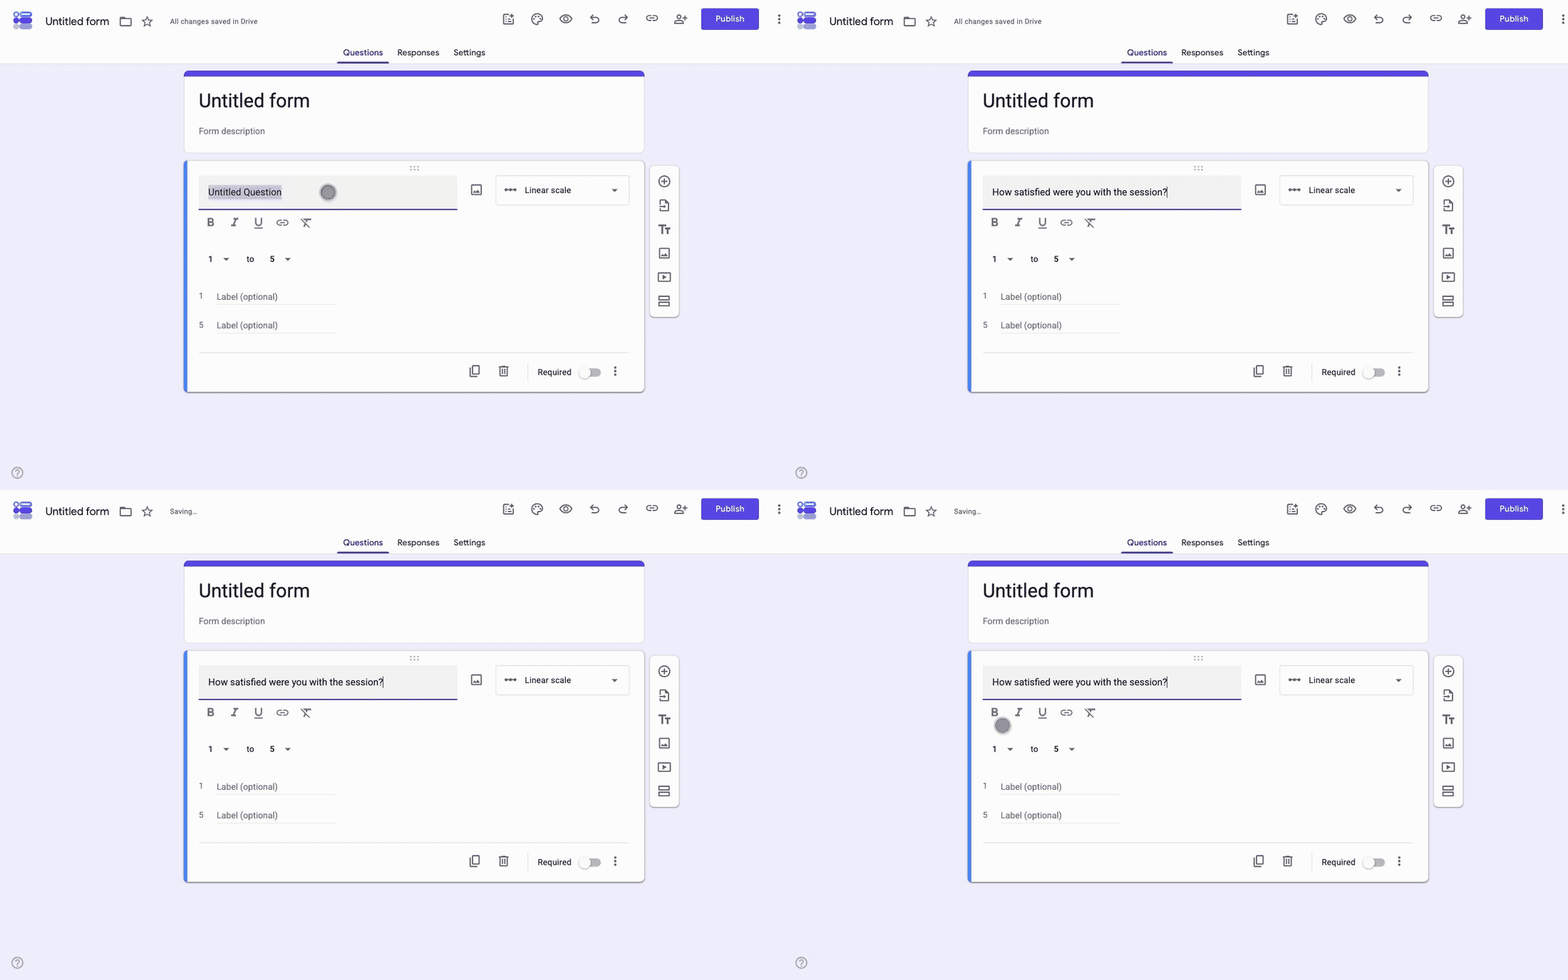
Click the plus icon in the floating toolbar to the right of the form. Type the question in the Question field before you change the type; a linear scale reads best as a single, concrete statement, so "How satisfied were you with the session?" rather than "Session feedback".
-
Change the type to Linear scale
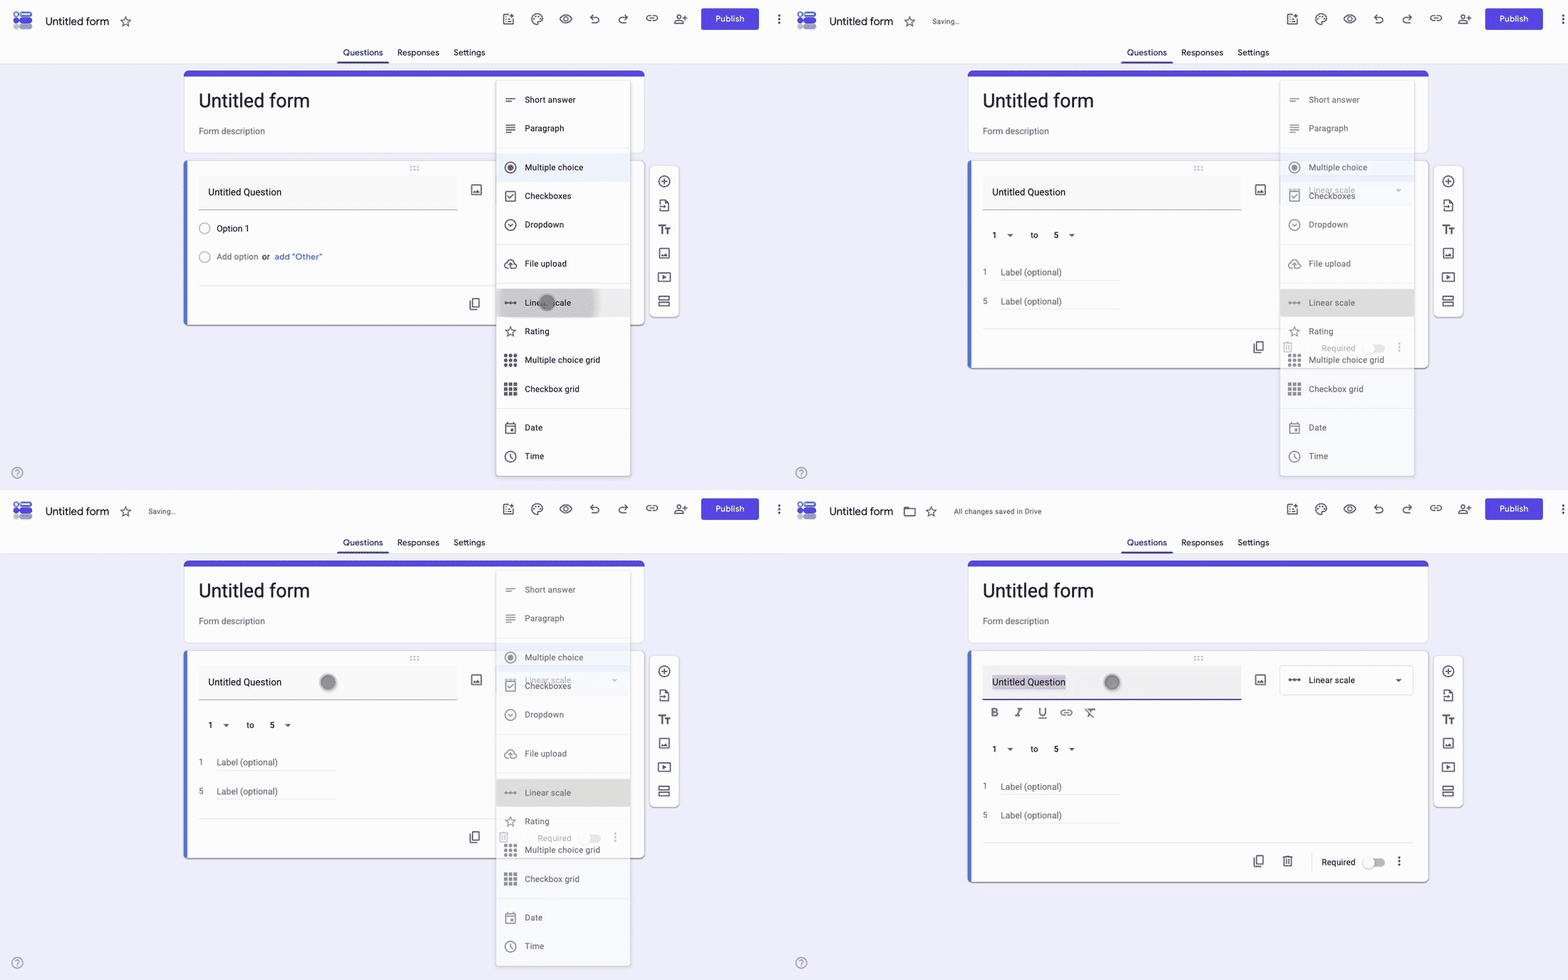
Open the question type dropdown, which says Multiple choice on a new question, and choose Linear scale. The options list is replaced by two dropdowns reading 1 to 5 and two label fields.
-
Set the range
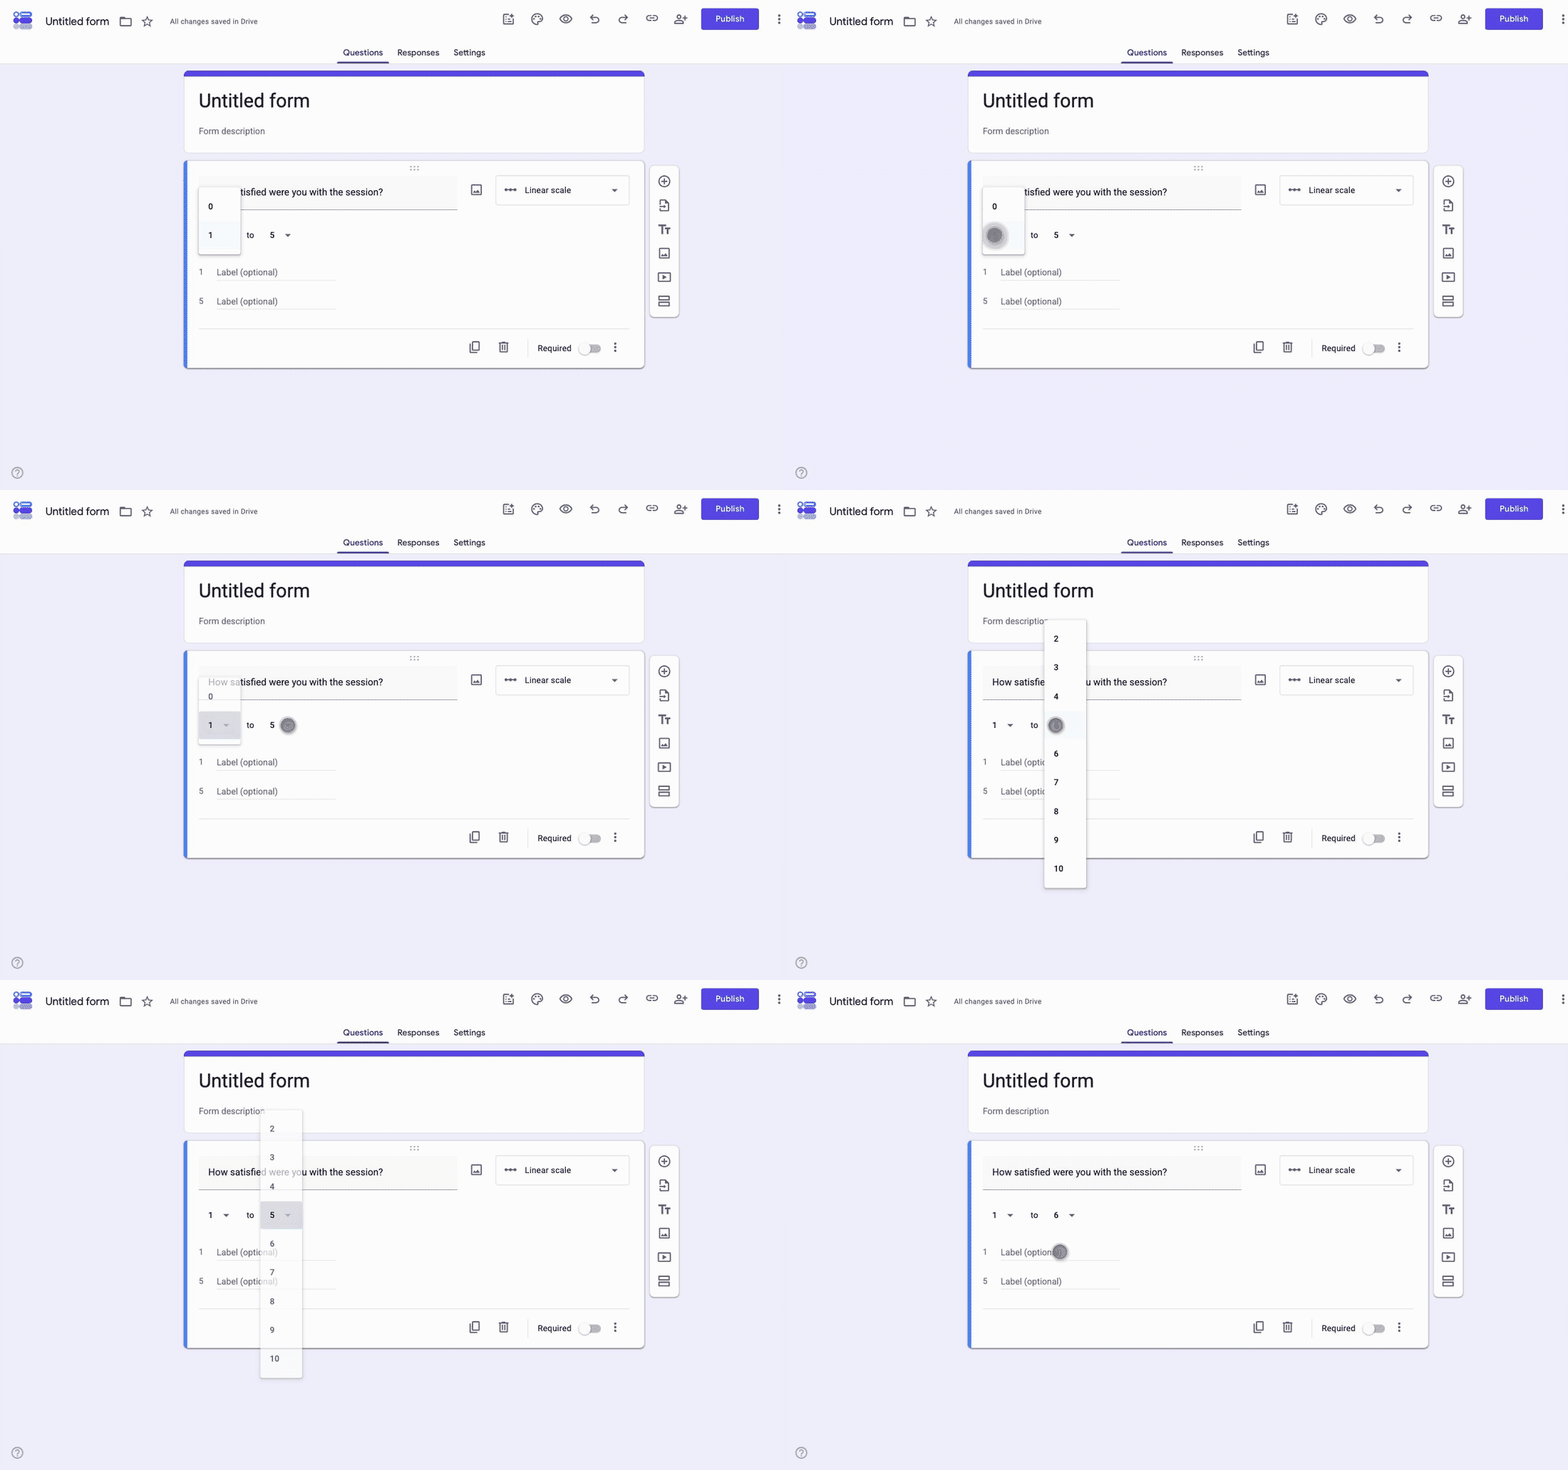
The first dropdown offers 0 or 1. The second offers 2 to 10. That is the whole range Google Forms allows: the smallest scale is 0 to 2 and the largest is 0 to 10. Pick 1 to 5 for satisfaction, 0 to 10 for a Net Promoter Score question, 1 to 7 if you are copying an academic agreement scale.
-
Label the two ends
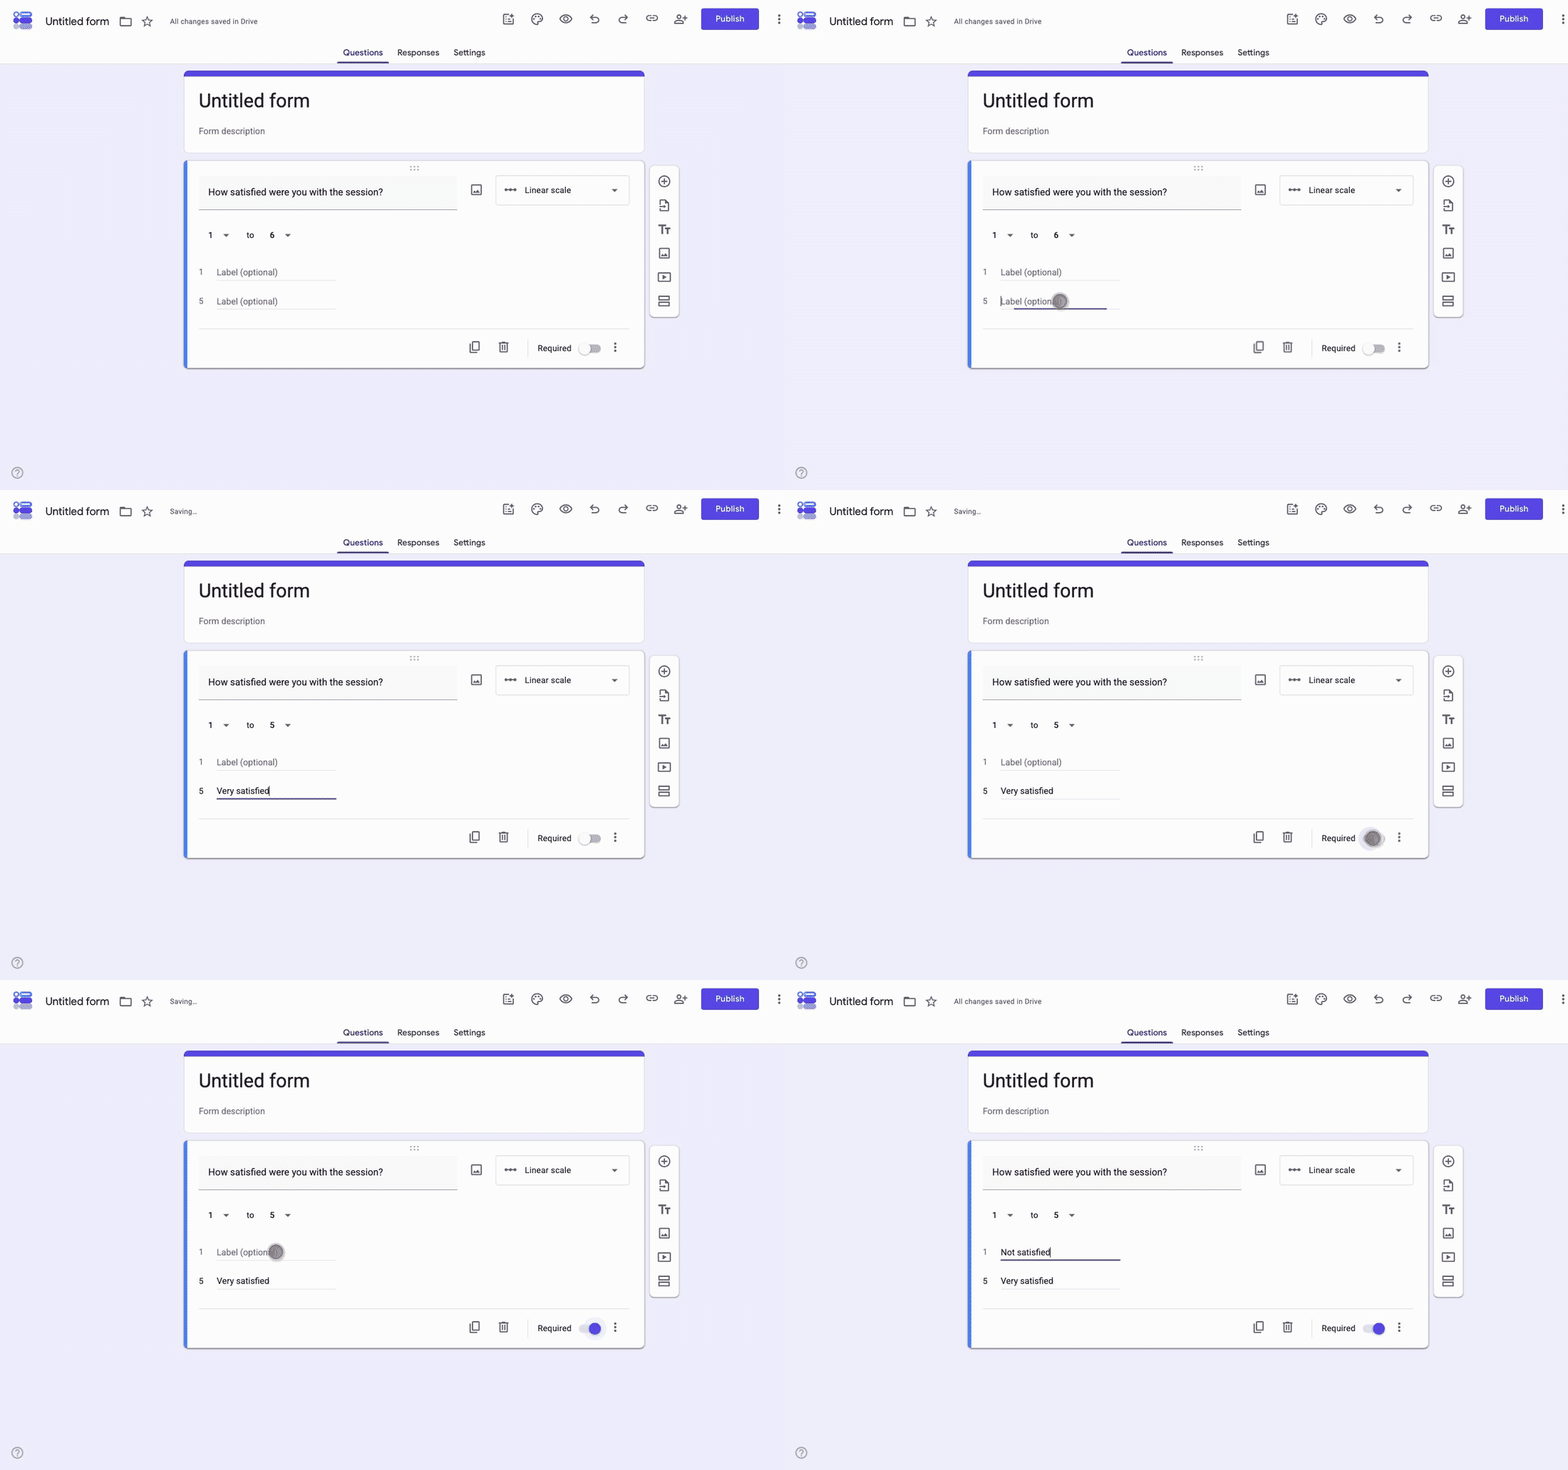
The two fields marked Label (optional) sit against the low and high numbers. Fill both, even though they are optional. "Not satisfied" and "Very satisfied", or "Strongly disagree" and "Strongly agree". A scale with unlabelled ends gets answered in both directions, and you will not be able to tell which respondents flipped it.
-
Mark it required, then preview
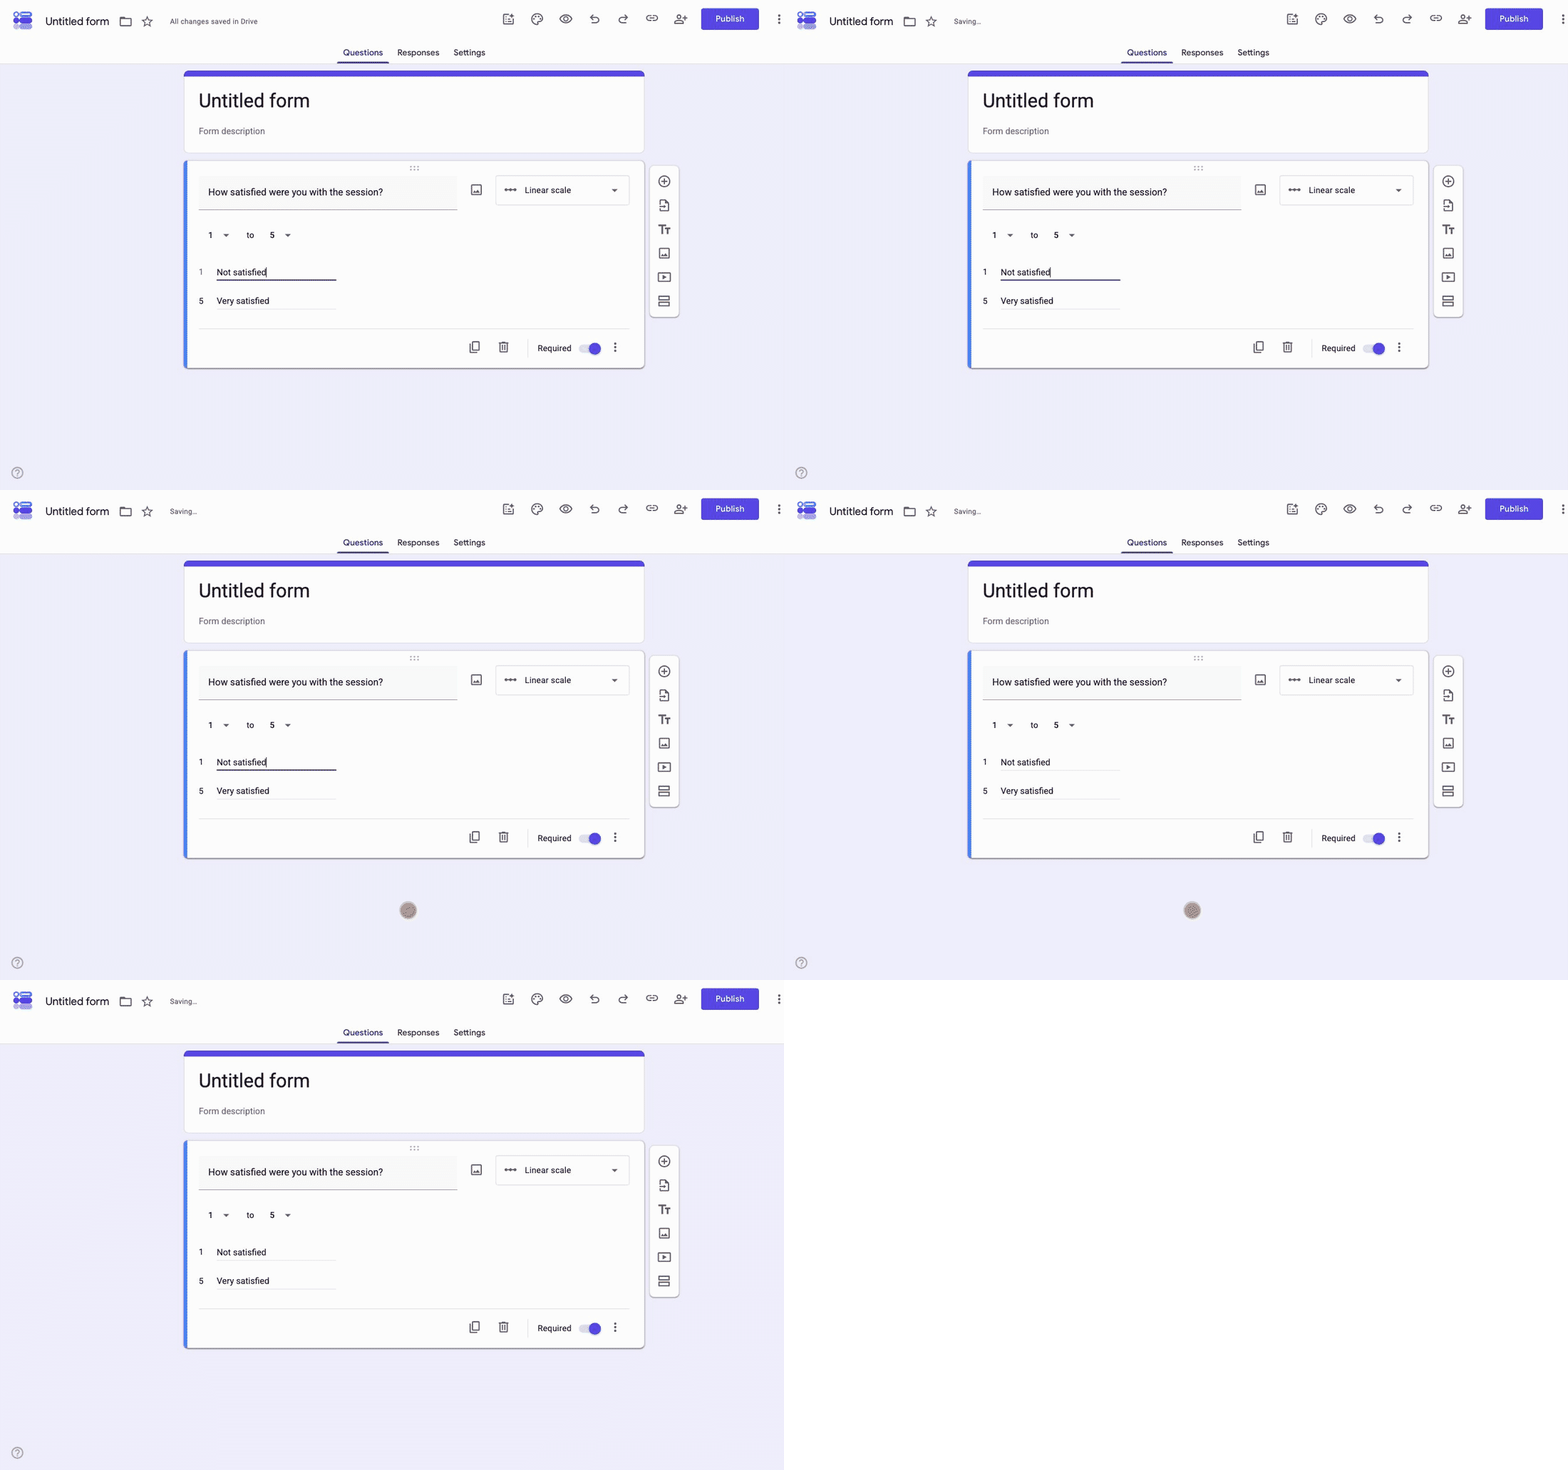
Toggle Required at the bottom right of the question if the form is pointless without this answer. Click the eye icon at the top to open the form as a respondent sees it and tap through the scale once on your phone. Google Forms saves as you go, so there is no save step.
What does a linear scale look like to the respondent?
A row of empty circles, one per number, with the numbers above them and your two labels at either end. On a phone the row stays horizontal until about seven points, then the circles get small enough that people mis-tap, which is one practical argument for 1 to 5 over 1 to 10 on a form most people will answer on a phone.
One tap selects a value and there is no way to select two. If the question is required, the form will not submit until a circle is filled.
In the Responses tab, a linear scale question shows as a bar chart of how many people chose each number. There is no average shown, so if you want a mean you export to Sheets, covered below.
Linear scale or Rating: which should you use?
Google Forms has a Rating question type that sits directly under Linear scale in the type menu. It is the same idea, a single value on a fixed range, drawn with icons instead of numbered circles. The first dropdown sets how many levels, from 3 to 10.
The second picks the icon: a star, a heart or a thumbs up. There are no labels to type, and respondents tap the icon that matches.
| Linear scale | Rating | |
|---|---|---|
| Shows as | Numbered circles in a row | Stars, hearts or thumbs in a row |
| Range | 0 or 1 up to 2 to 10 | 3 to 10 |
| Labels | Two, one at each end | None; the icons are the label |
| Data in Sheets | The number chosen | The number of icons chosen |
| Reads as | A measurement | A reaction |
| Use it for | NPS, agreement scales, anything you will average or compare over time | Product, event and service ratings where speed of answering matters more than precision |
The honest rule: if you are going to put the answers on a chart, calculate an average or compare this quarter to last quarter, use Linear scale and keep the same range everywhere. If you want people to answer without thinking, stars win. Five of them is the pattern everyone already understands from app stores and delivery apps.
Which scale range should you use?
- 1 to 5: the default and the right answer for most satisfaction and quality questions. Five points is enough to separate happy from unhappy, and it fits on a phone screen.
- 0 to 10: the Net Promoter Score range. Label 0 "Not at all likely" and 10 "Extremely likely", ask "How likely are you to recommend us to a friend or colleague?", and score 9 and 10 as promoters, 7 and 8 as passives, 0 to 6 as detractors. Google Forms will not do that arithmetic; Sheets will.
- 1 to 7: what most published agreement scales use, with a genuine neutral point in the middle. Use it if you are replicating a survey instrument, otherwise five points collects the same signal with less squinting.
- Even ranges (1 to 4, 1 to 6): no neutral option, so people are forced to lean one way. Useful when "neither" is the answer you do not want to receive.
Whichever you pick, keep it the same for every scale question in the form. A survey that runs 1 to 5, then 0 to 10, then 1 to 7 gets answers that cannot be compared and respondents who stop reading the labels.
How do you make a Likert scale in Google Forms?
A Likert scale is a set of statements all answered on the same agreement scale, and the Google Forms question for that is the Multiple choice grid, not a stack of linear scales.
Add a question, choose Multiple choice grid, put each statement in a row ("The session was well organised", "The speaker knew the material") and the agreement options in the columns (Strongly disagree, Disagree, Neutral, Agree, Strongly agree). Respondents pick one column per row.
The grid also gives you what linear scale cannot: a label on every point, because the column headers are the labels.
Turn on Require a response in each row from the grid's settings if every statement must be answered. For the theory behind the format, and how to word statements so the scale actually measures something, see the Likert scale guide, or start from the Likert scale survey template.
How do you turn linear scale answers into a score?
Google Forms does not add scores from linear scale questions. Quiz mode assigns points to choice questions with a correct answer, and a scale has no correct answer, so the total stays at zero. The Responses tab charts each question separately and shows no averages.
The route is the spreadsheet. In the Responses tab click Link to Sheets, and every submission becomes a row with one column per question.
From there, a total per respondent is =SUM(B2:F2) dragged down, an average per question is =AVERAGE(B:B) at the foot of each column, and an NPS is the percentage of 9s and 10s minus the percentage of 0s to 6s. Linking Google Forms to Google Sheets covers the setup and the ways the link breaks.
What Google Forms linear scale cannot do
- Go past 10: the high dropdown ends at 10. A 1 to 100 scale, or 0 to 20, has to be a Short answer with response validation set to a number between two values, and you lose the tap-to-answer row.
- Label the middle: only the two ends take text. If every point needs a word, use a Multiple choice question with five worded options, or the grid described above.
- Slide: there is no slider control; the scale is always a row of circles.
- Branch on the value: Go to section based on answer works on Multiple choice and Dropdown questions, not on Linear scale, so you cannot send a 1 to a "what went wrong" section and a 5 to a "would you recommend us" section. Conditional questions in Google Forms explains what branching can and cannot key off.
- Score or average: covered above, it is a Sheets job.
- Look like yours: the circles take the form's theme colour and nothing else. No icons of your own, no half points, no numeric input.
Where Formester fits
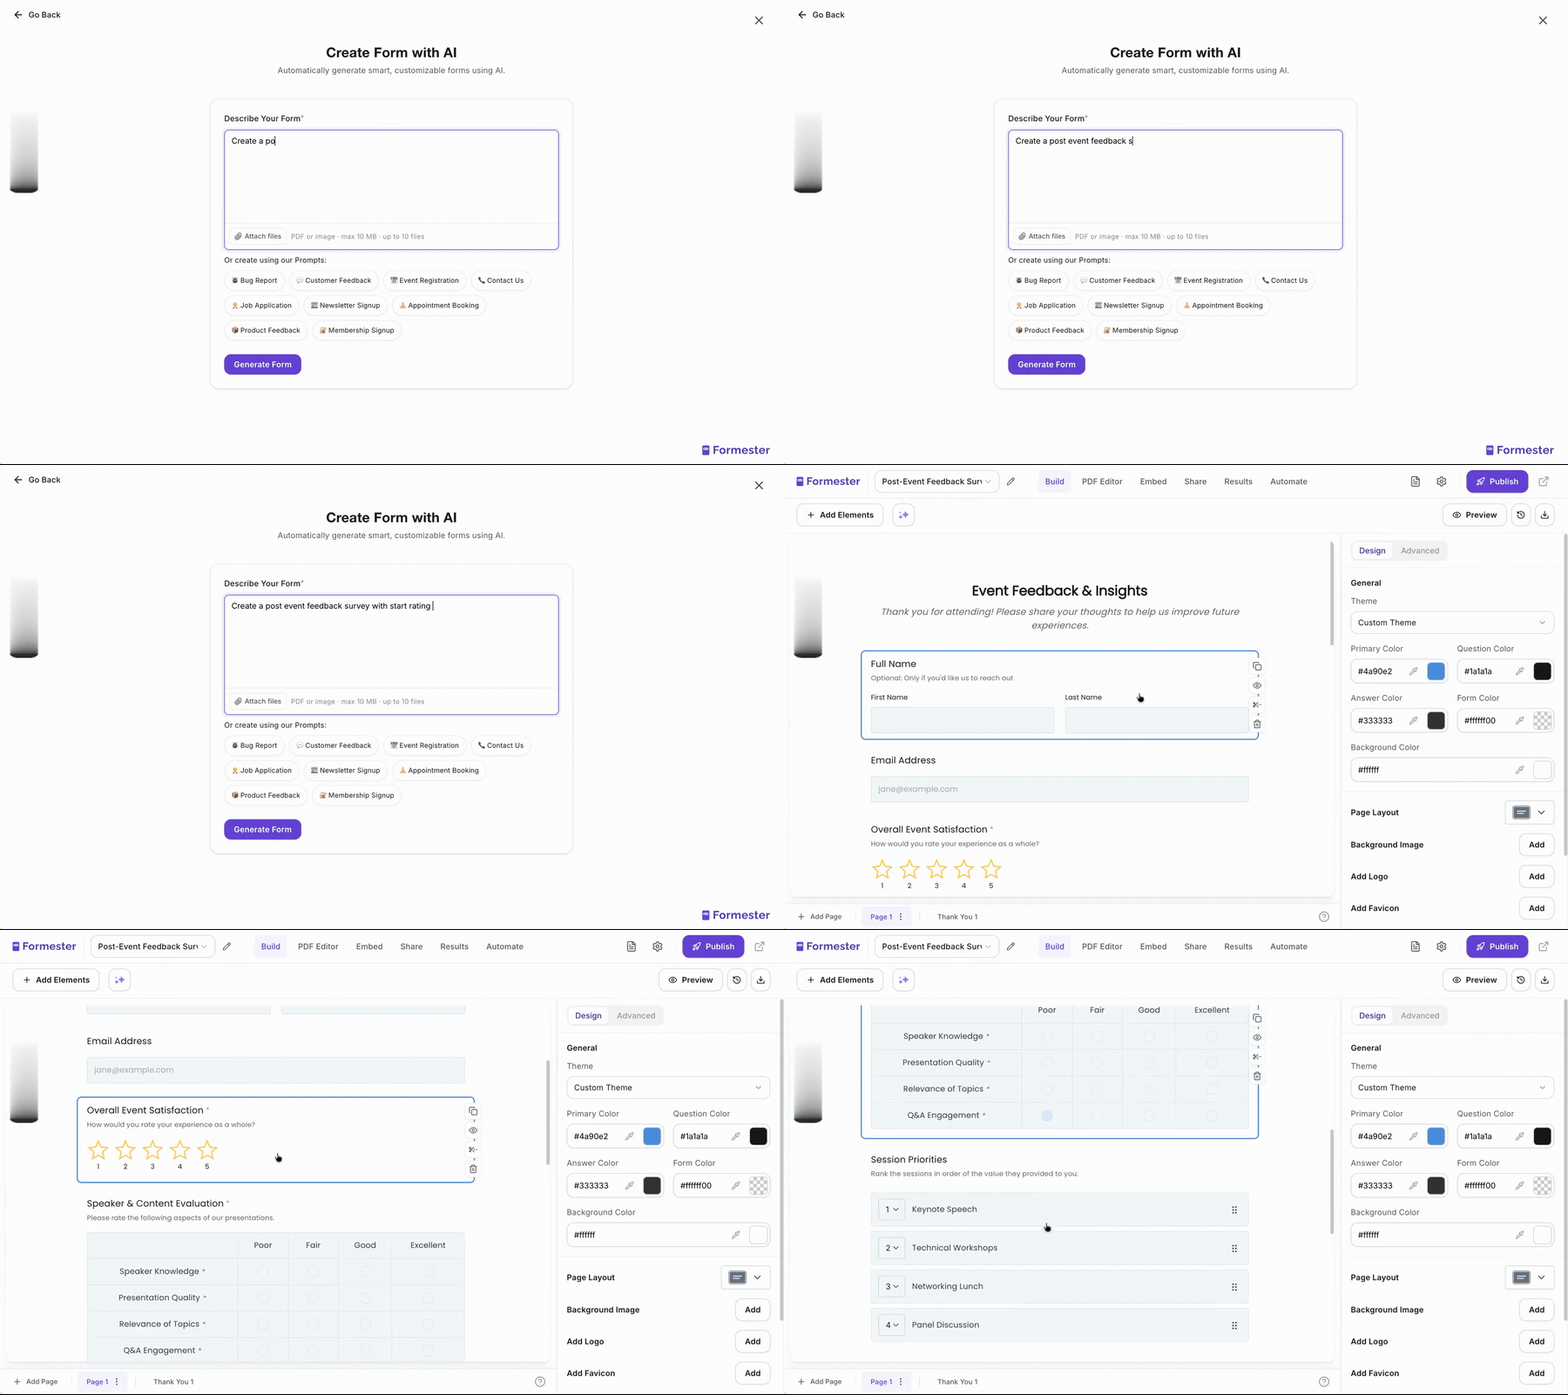
Start by describing the survey instead of building it.
On the create screen, the AI survey generator takes a sentence like "post-event feedback survey with a satisfaction rating and a question about which sessions were most useful" and writes the whole form, the rating scale and its labels included, with a star rating for the overall question and a matrix for rating several sessions at once.
Everything it writes is editable, and the scale, star rating and ranking fields are all there in the element list if you would rather place them by hand.
Responses come with summary charts for every rating field, so the average that Google Forms sends you to a spreadsheet for is on screen, and the form itself carries your logo and colours rather than a theme. The form also needs no Google account from anyone answering, which matters for a feedback link on a receipt or a slide.
What Formester does not do is stretch a scale to 100 points either; if you need that, it is a number field with a minimum and a maximum, same as it is anywhere else.
A feedback survey the AI writes for you
Describe it once. The rating scale, the labels and the follow-up question arrive built, ready to edit and publish.
Try Formester freeFree forever · No credit card · 56,000+ teams
Related reading
- How to make a questionnaire in Google Forms, for choosing question types across a whole survey.
- Survey questions worth asking, with the scale questions that produce usable answers.
- Pie charts in Google Forms, for what the Responses tab draws and what it will not.
- How to make a Google Form anonymous, because people rate more honestly when their name is not attached.
- Evaluation forms in Google Forms, the most common home for a row of linear scales.
- How to use Google Forms, for the parts of the builder this page assumes.